Zoom into Top of Y-Axis Range
MRTG Graphs |
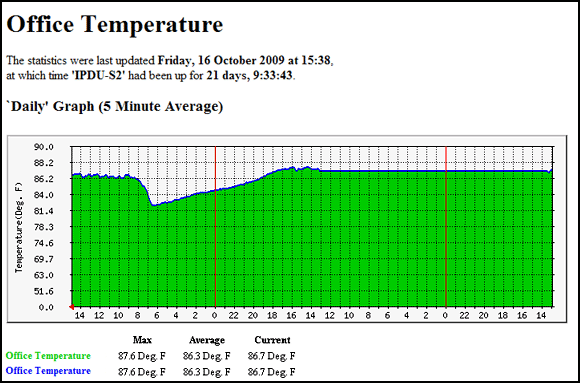
| The y-axis is normally scaled linearly from 0 to some upper limit. This may make it difficult to see small changes. One way to zoom into the graph and magnify the changes is to enable exponential scaling of the y-axis. To do this, add the expscale option to the Options[] for each target. |
| |
| |
| |
| |
| |
| |
Close Window |
