Server Room Monitoring, Remote Environment Monitoring Sample Configuration File
Sensor Data Graphs, MRTG, How To
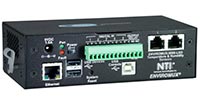
Mini Server Environment Monitoring System
Graphs the Data from Sensors Using MRTG
Also known as: Remote Server Environment Monitoring System, monitor computer rooms, data center thermometer, temperature humidity sensor reading, computer room temperature alert.
The ENVIROMUX-MINI-LXO Graphs the Data from its Sensors Using MRTG

ENVIROMUX-MINI-LXO
The ENVIROMUX-MINI-LXO Server Environment Monitoring System can graph the data from its sensors using MRTG (Multi Router Traffic Grapher). This provides a visual representation of the critical environmental conditions being monitored. MRTG generates HTML pages containing regularly updated PNG images providing graphical trending of time-series data. The graphs display daily, weekly, monthly and yearly statistics of the environmental conditions being monitored.
Sample Graphs
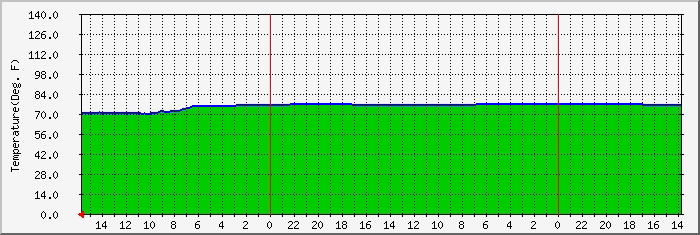
'Daily' Graph (5 Minute Average)
| Max | Average | Current | ||
| 76.7 °F | 75.2 °F | 70.8 °F |
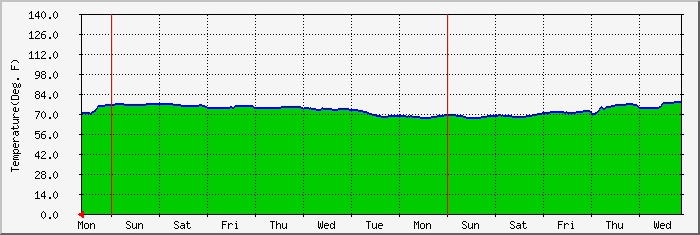
'Weekly Graph' (30 Minute Average)

| Max | Average | Current | ||
| 78.3 °F | 72.4 °F | 70.3 °F |
Configuration
Configure MRTG to graph environmental conditions using the ENVIROMUX-MINI-LXO Server Environment Monitoring System:1) Install MRTG on your computer using the MRTG installation guide.
- Installation procedure is available at:
2) Configure the ENVIROMUX-MINI-LXO server environment monitoring system to monitor the environmental conditions you want.
3) Create a MRTG configuration file that controls the graphs.
- Download the ENVIROMUX-MINI-LXO configmaker for MRTG
- How to use the ENVIROMUX-MINI-LXO configmaker for MRTG
- Note: You can also edit the summary HTML file below to display data from the sensors you use:
- The first few times MRTG is run with a newly created env-mini config, it will show non critical errors and does not cause any long term issues. This will only happen once for each sensor. After each sensor is tried once, these messages will go away and MRTG will operate as expected.
5) Create a cron job to run MRTG on UNIX machines. Use a daemon on Windows.
6) Modify MRTG graphs.
- The default graphs generated by the MRTG configuration script can be modified. Following are examples of changes to the graphs that can be made.

